
Project 2: Identifying High-Potential Accounts for Sales Targeting
Identifying High-Potential Accounts for Sales Targeting
Overview
This project focuses on identifying high-potential accounts for sales targeting using a data-driven approach. We leveraged a Target Account List (TAL) to identify 30 high-potential accounts, yielding potentially ~5.4 million USD yearly.
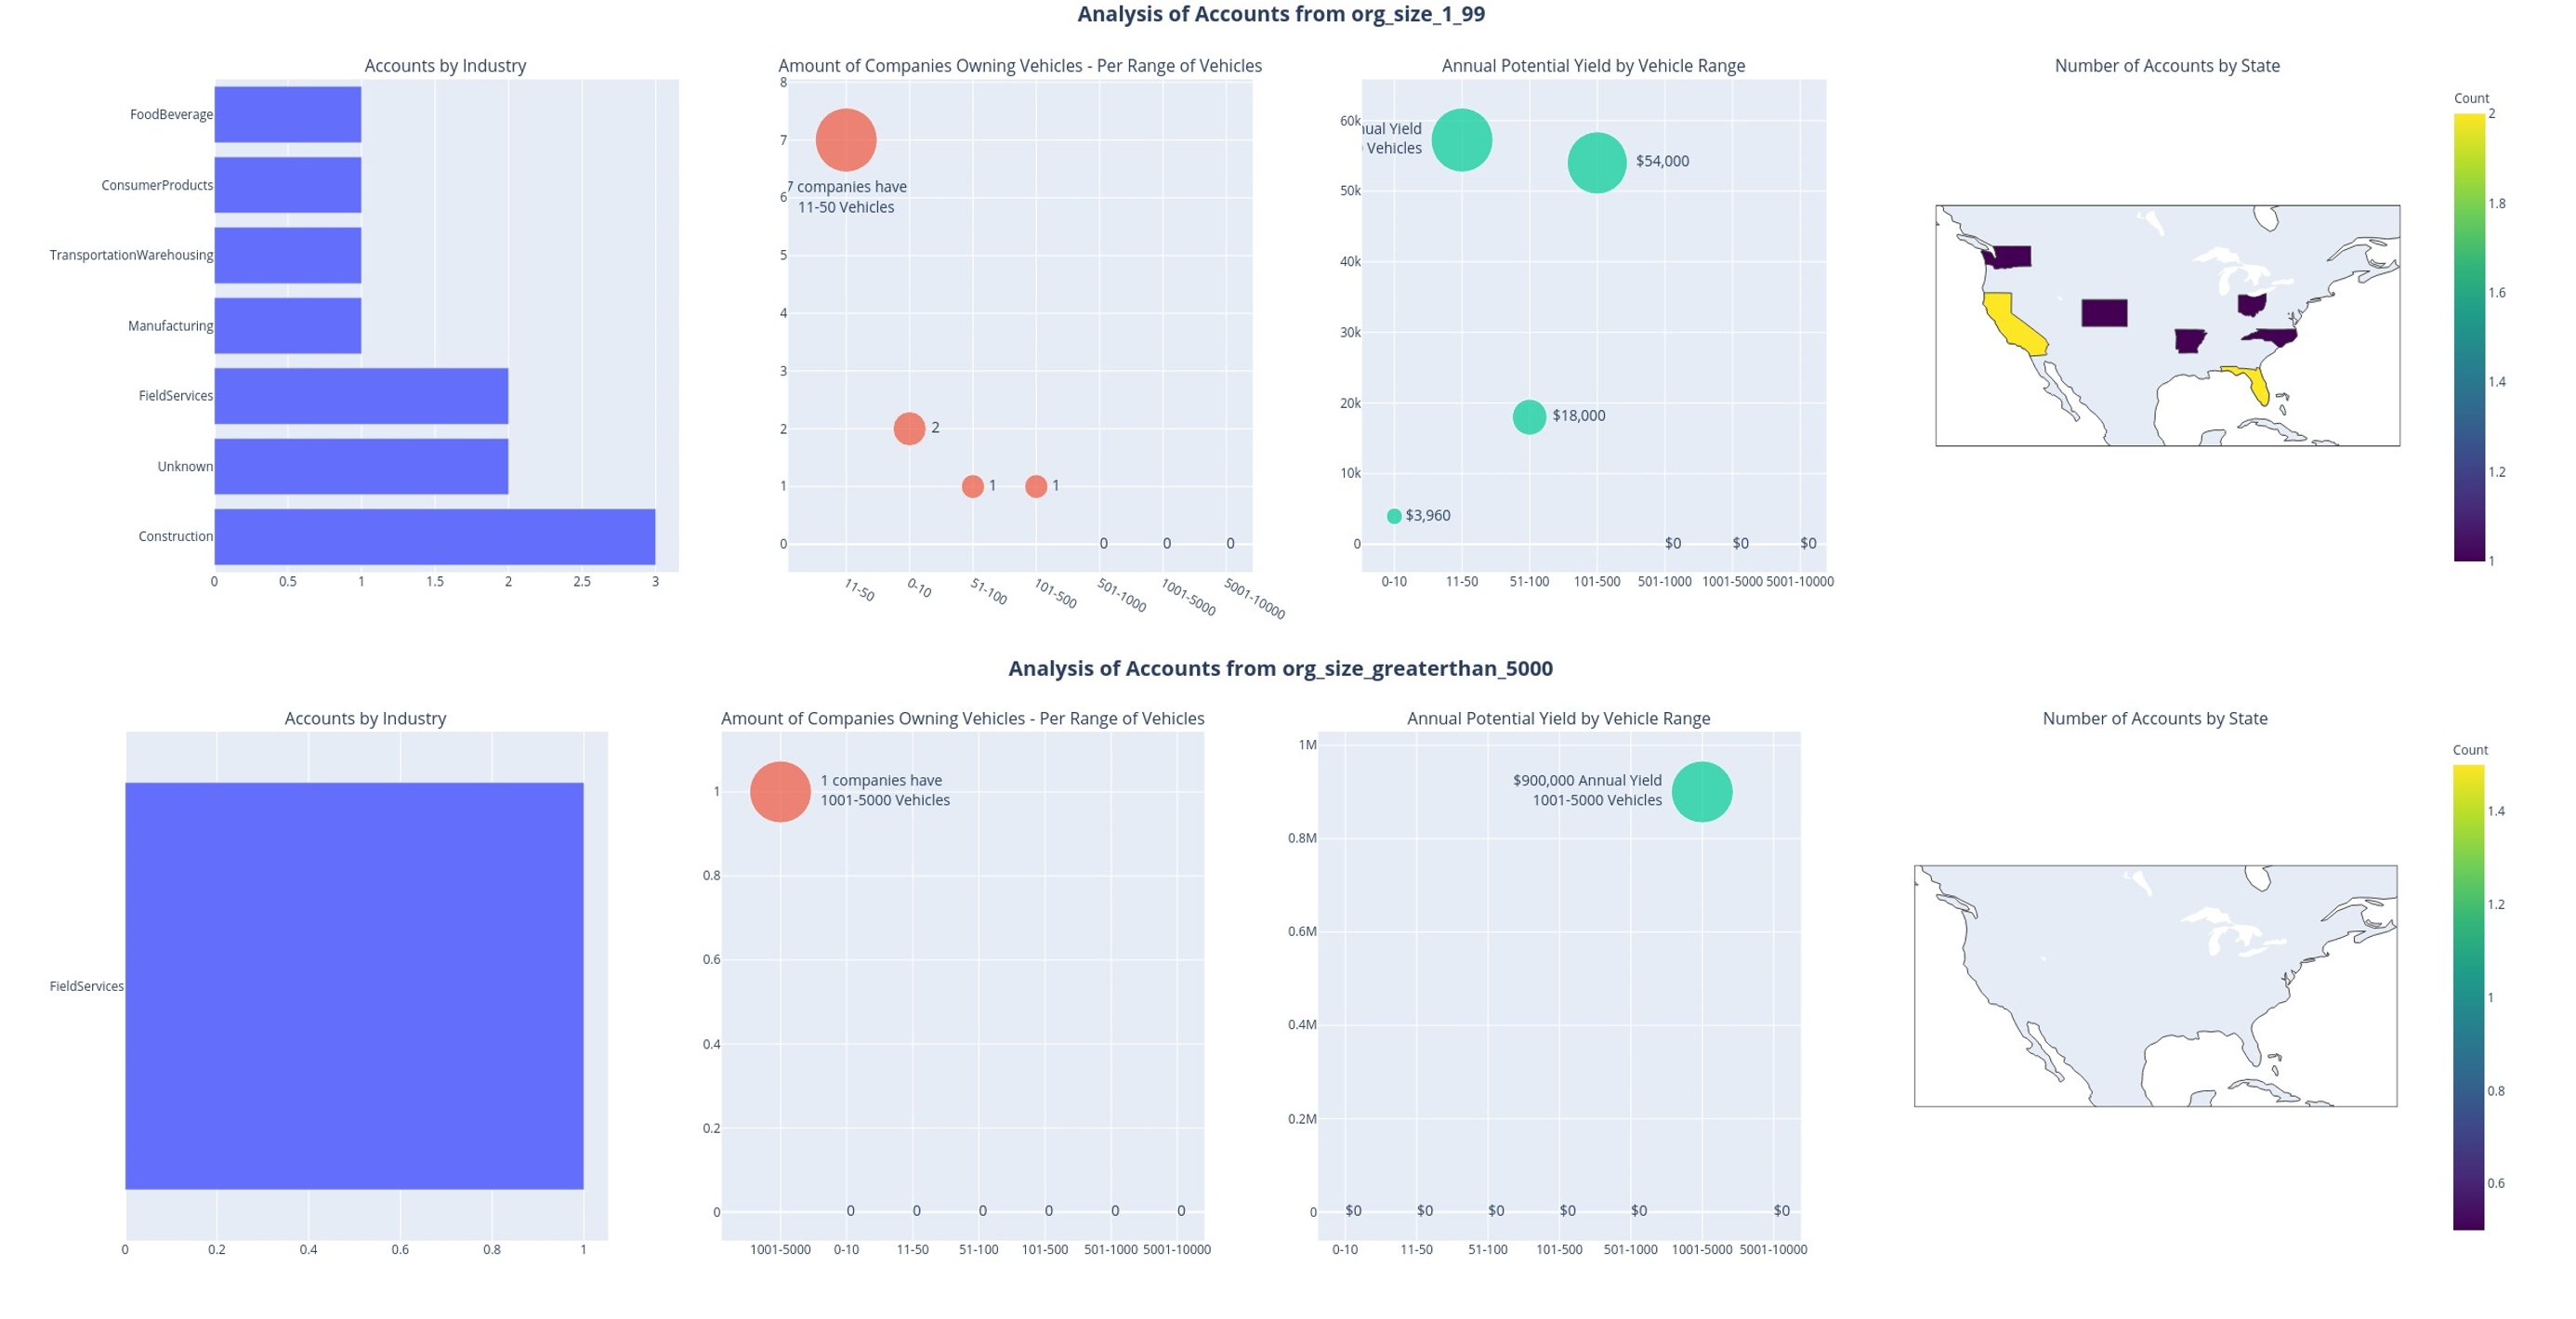
Data Overview
The dataset consists of over 3,000 companies across six different datasets. For training and testing purposes, the data was divided as follows:
- Train: 254 observations (122 sales)
- Test: 132 observations
Feature engineering was applied to enhance the dataset, resulting in around 100 features including lag and rolling features, days between engagements, average weekly engagement rate, etc.
Feature Selection
Random Forest was used for feature selection to identify the most important predictors for the model.
Model: Additive Logistic Regression
The model used for predicting high-potential accounts is Additive Logistic Regression. This model allows us to handle the sparsity in the data and provides a probabilistic framework for prediction.
The logistic regression model is defined as:
\[ P(Y = 1 | X) = \frac{1}{1 + e^{-(\beta_0 + \sum_{i=1}^{n} \beta_i X_i)}} \]
Where:
- \( P(Y = 1 | X) \) is the probability that the outcome \( Y \) is 1 given the predictors \( X \).
- \( \beta_0 \) is the intercept term.
- \( \beta_i \) are the coefficients for each predictor \( X_i \).
In our additive model, we include interaction terms and polynomial terms to capture non-linear relationships:
\[ P(Y = 1 | X) = \frac{1}{1 + e^{-(\beta_0 + \sum_{i=1}^{n} \beta_i X_i + \sum_{j=1}^{m} \gamma_j Z_j)}} \]
Where:
- \( Z_j \) represents interaction or polynomial terms derived from the original predictors.
- \( \gamma_j \) are the coefficients for these interaction or polynomial terms.
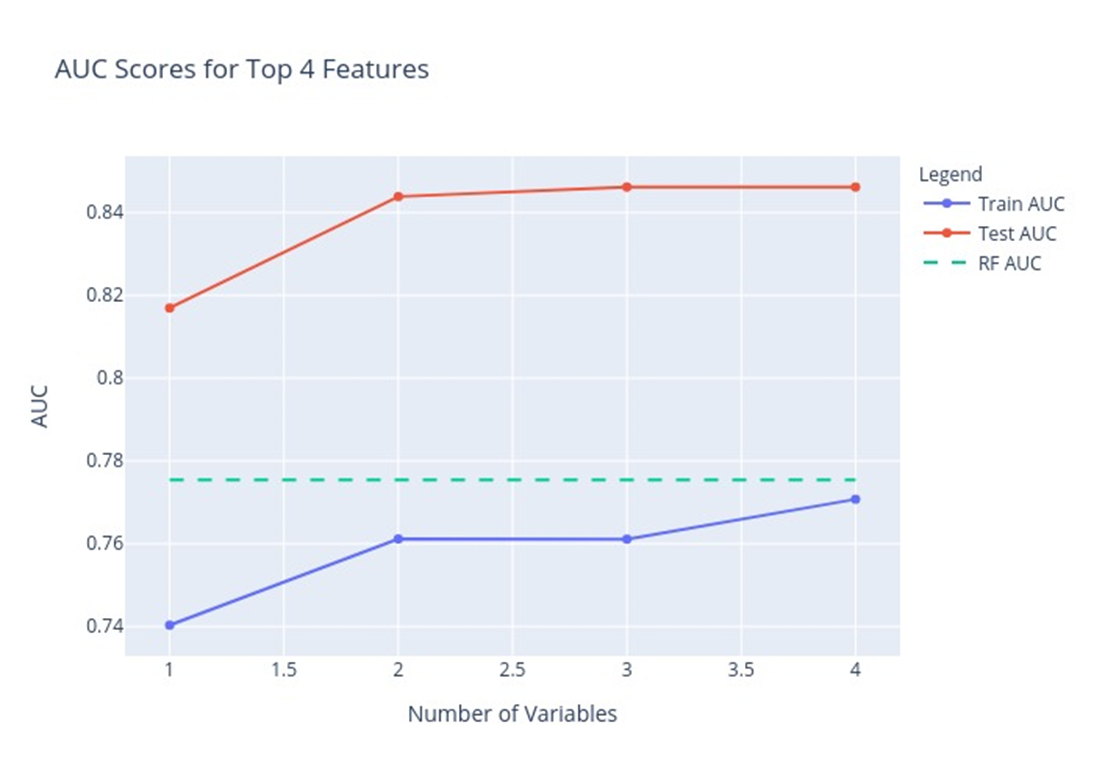
Prediction Results
The model provided the following prediction results:
- With 4 predictors: Identified 40 potential customers
- With 10 predictors: Identified 35 potential customers (30 in common with the 4 predictors model)
The potential revenue from these high-potential accounts is estimated to be:
- Total of ~3.9 million USD with the 4 predictors model
- Total of ~1.6 million USD with the 10 predictors model
Insights and Business Impact
This project provided significant insights and had a substantial business impact. It highlighted the most important factors driving sales and helped prioritize accounts with the highest potential, thereby optimizing the sales strategy.
Repository and Resources
For more details and access to the code, please visit the GitHub Repository.
To read the full analysis, you can download the PDF file.