
Project 2: Stock Return Prediction
Stock Return Prediction
Challenge Goals
Link: Link to the Data Challenge by QRT HERE
The proposed challenge aims at predicting the return of a stock in the US market using historical data over a recent period of 20 days. The one-day return of a stock j on day t with price Pjt (adjusted from dividends and stock splits) is given by:
In this challenge, we consider the residual stock return, which corresponds to the return of a stock without the market impact. Historical data are composed of residual stock returns and relative volumes, sampled each day during the 20 last business days (approximately one month). The relative volume Vjt at time t of a stock j among the n stocks is defined by:
where V^{t} is the volume at time t of a stock j. We also give additional information about each stock such as its industry and sector.
The metric considered is the accuracy of the predicted residual stock return sign.
Data Description
The dataset comprises 46 descriptive features (all float/int values):
- DATE: an index of the date (the dates are randomized and anonymized so there is no continuity or link between any dates),
- STOCK: an index of the stock,
- INDUSTRY: an index of the stock industry domain (e.g., aeronautic, IT, oil company),
- INDUSTRY_GROUP: an index of the group industry,
- SUB_INDUSTRY: a lower level index of the industry,
- SECTOR: an index of the work sector,
- RET_1 to RET_20: the historical residual returns among the last 20 days (i.e., RET_1 is the return of the previous day and so on),
- VOLUME_1 to VOLUME_20: the historical relative volume traded among the last 20 days (i.e., VOLUME_1 is the relative volume of the previous day and so on).
Output datasets are only composed of 2 columns:
- ID: the unique row identifier (corresponding to the input identifiers) and the binary target:
- RET: the sign of the residual stock return at time t
418,595 observations (i.e., lines) are available for the training datasets while 198,429 observations are used for the test datasets.
Target Variable
RET: The sign of the residual stock return at time t (binary).
Feature Engineering
To enhance the dataset and improve prediction accuracy, the following feature engineering techniques were applied:
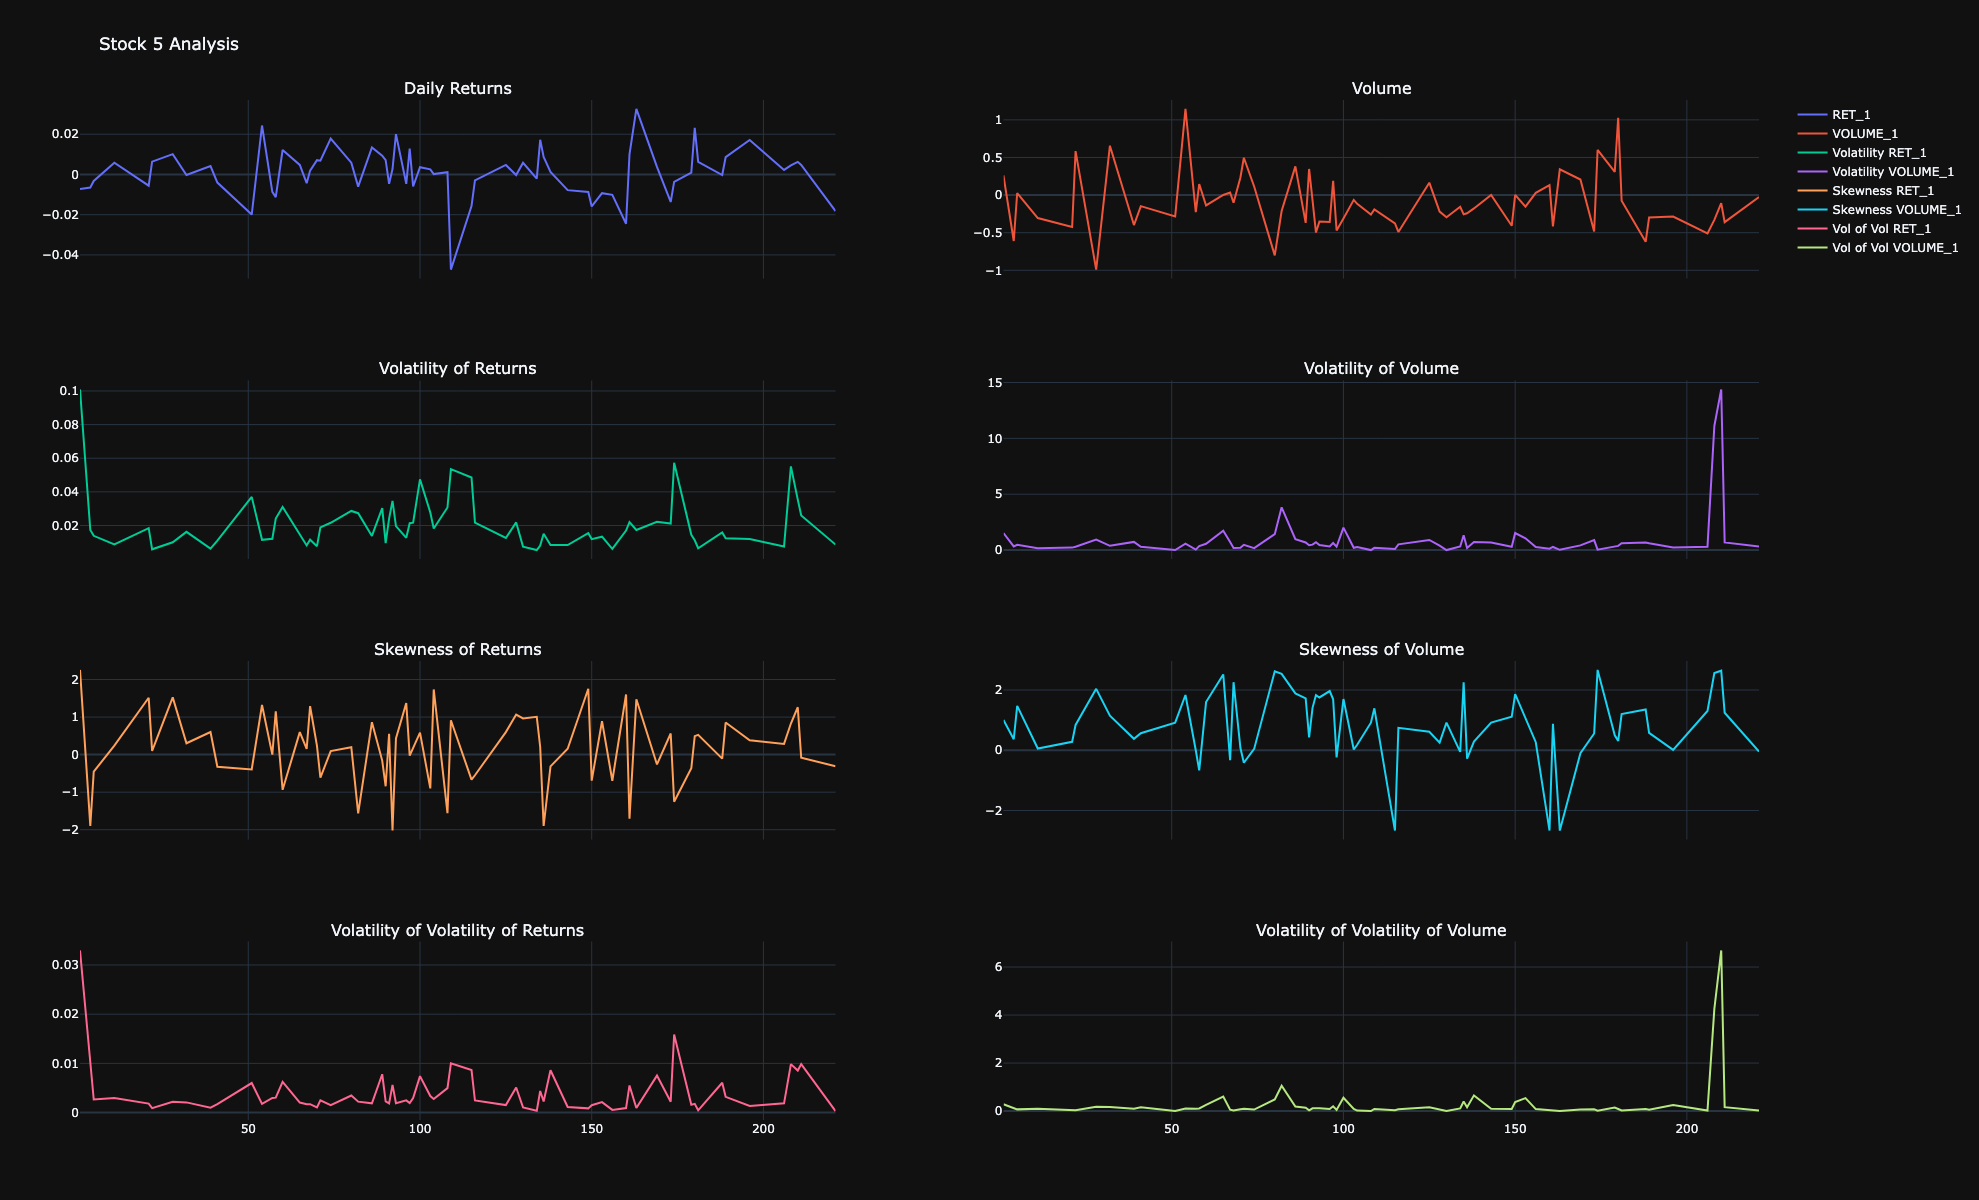
1. Volatility Measures
Rolling Standard Deviation:
Volatility of Volatility (Vol of Vol) (std of std):
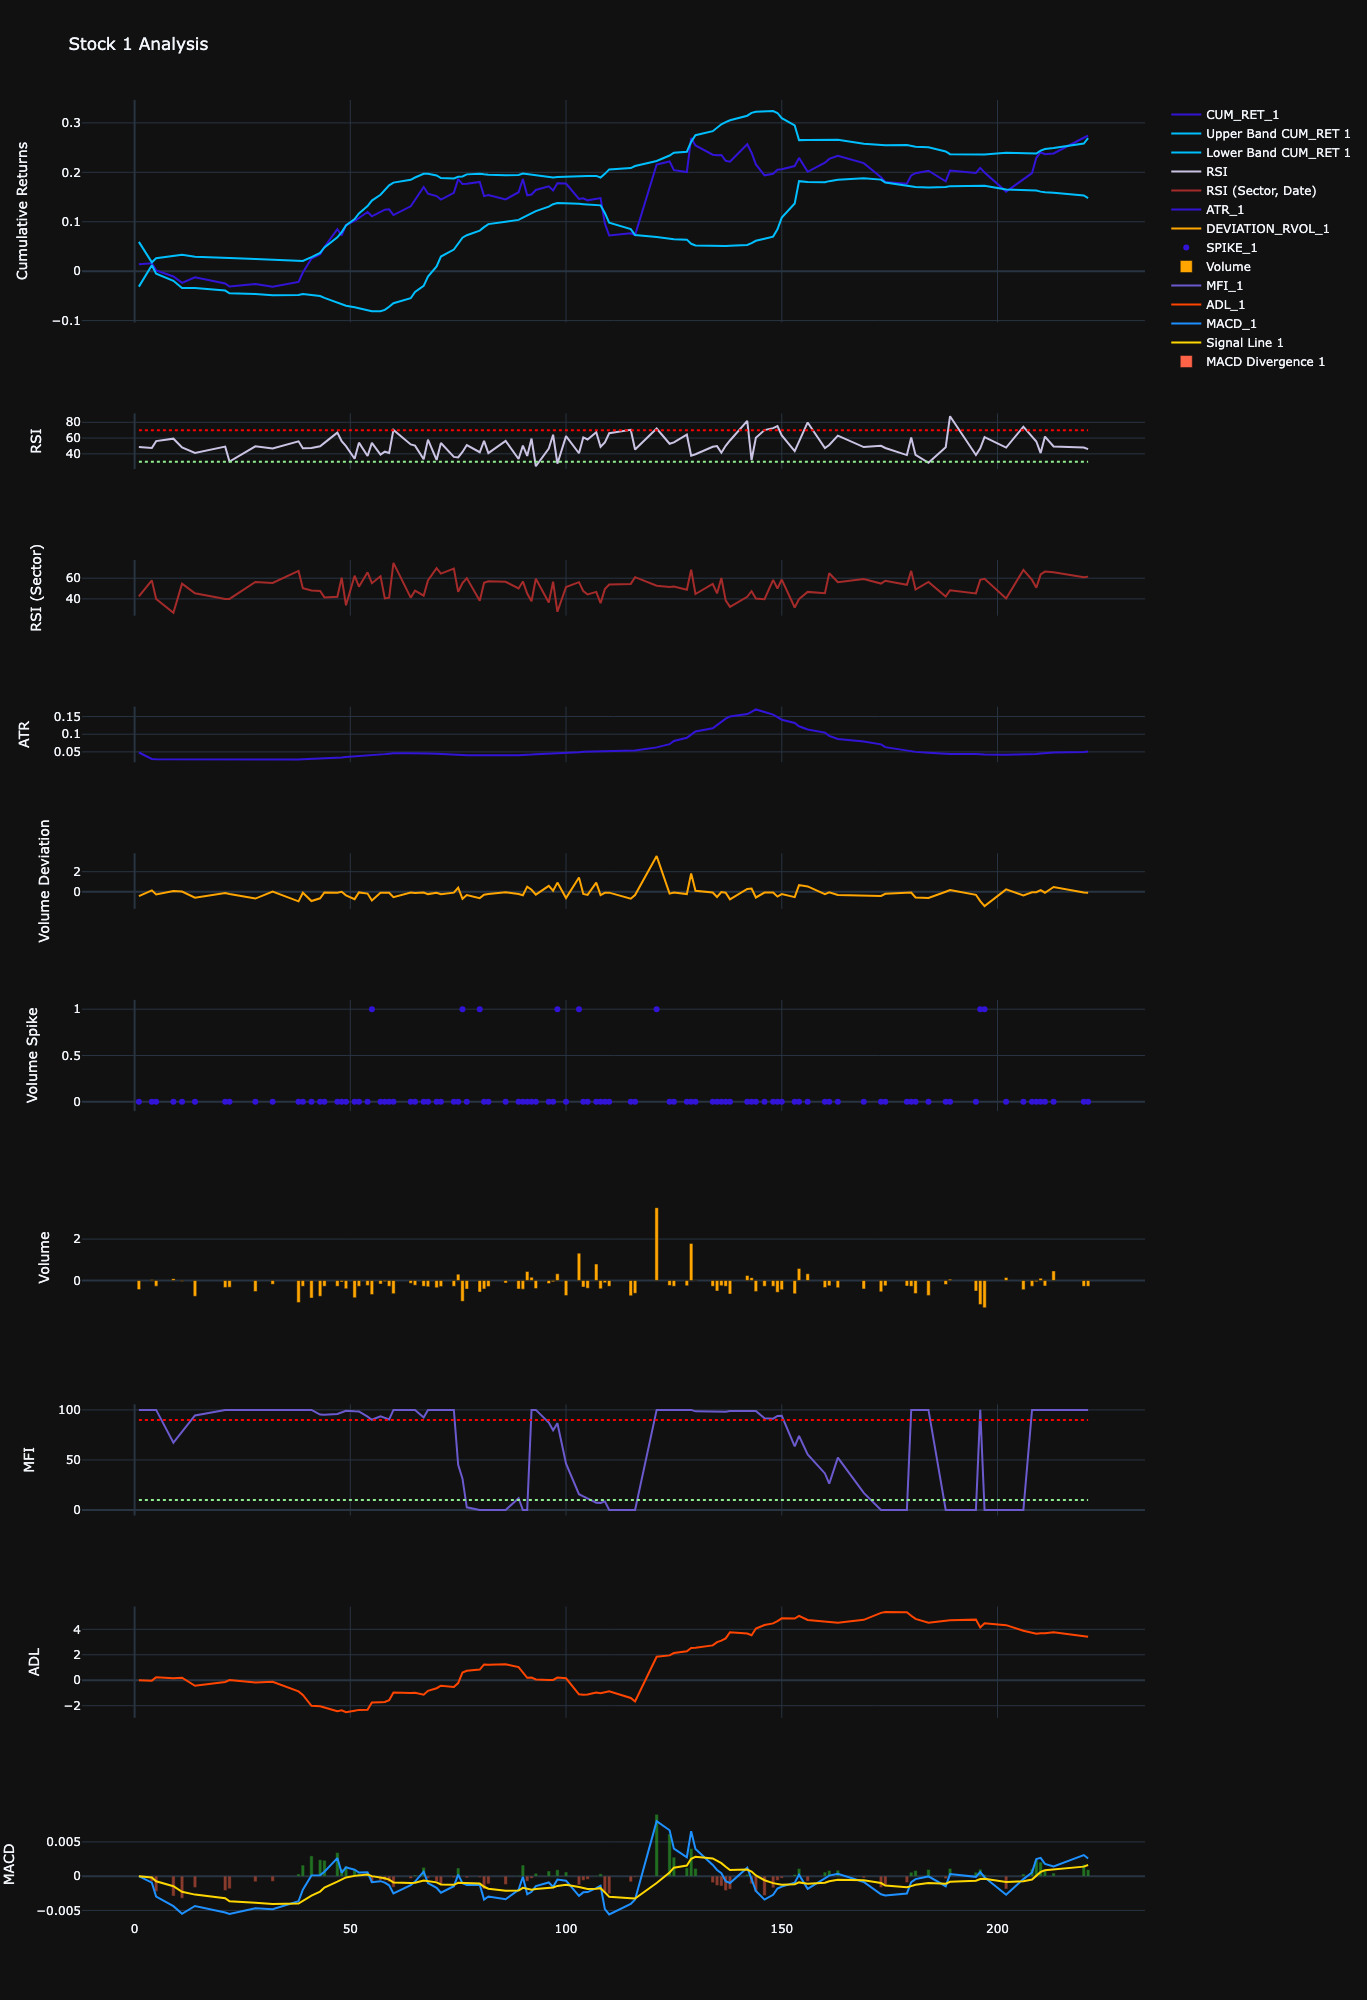
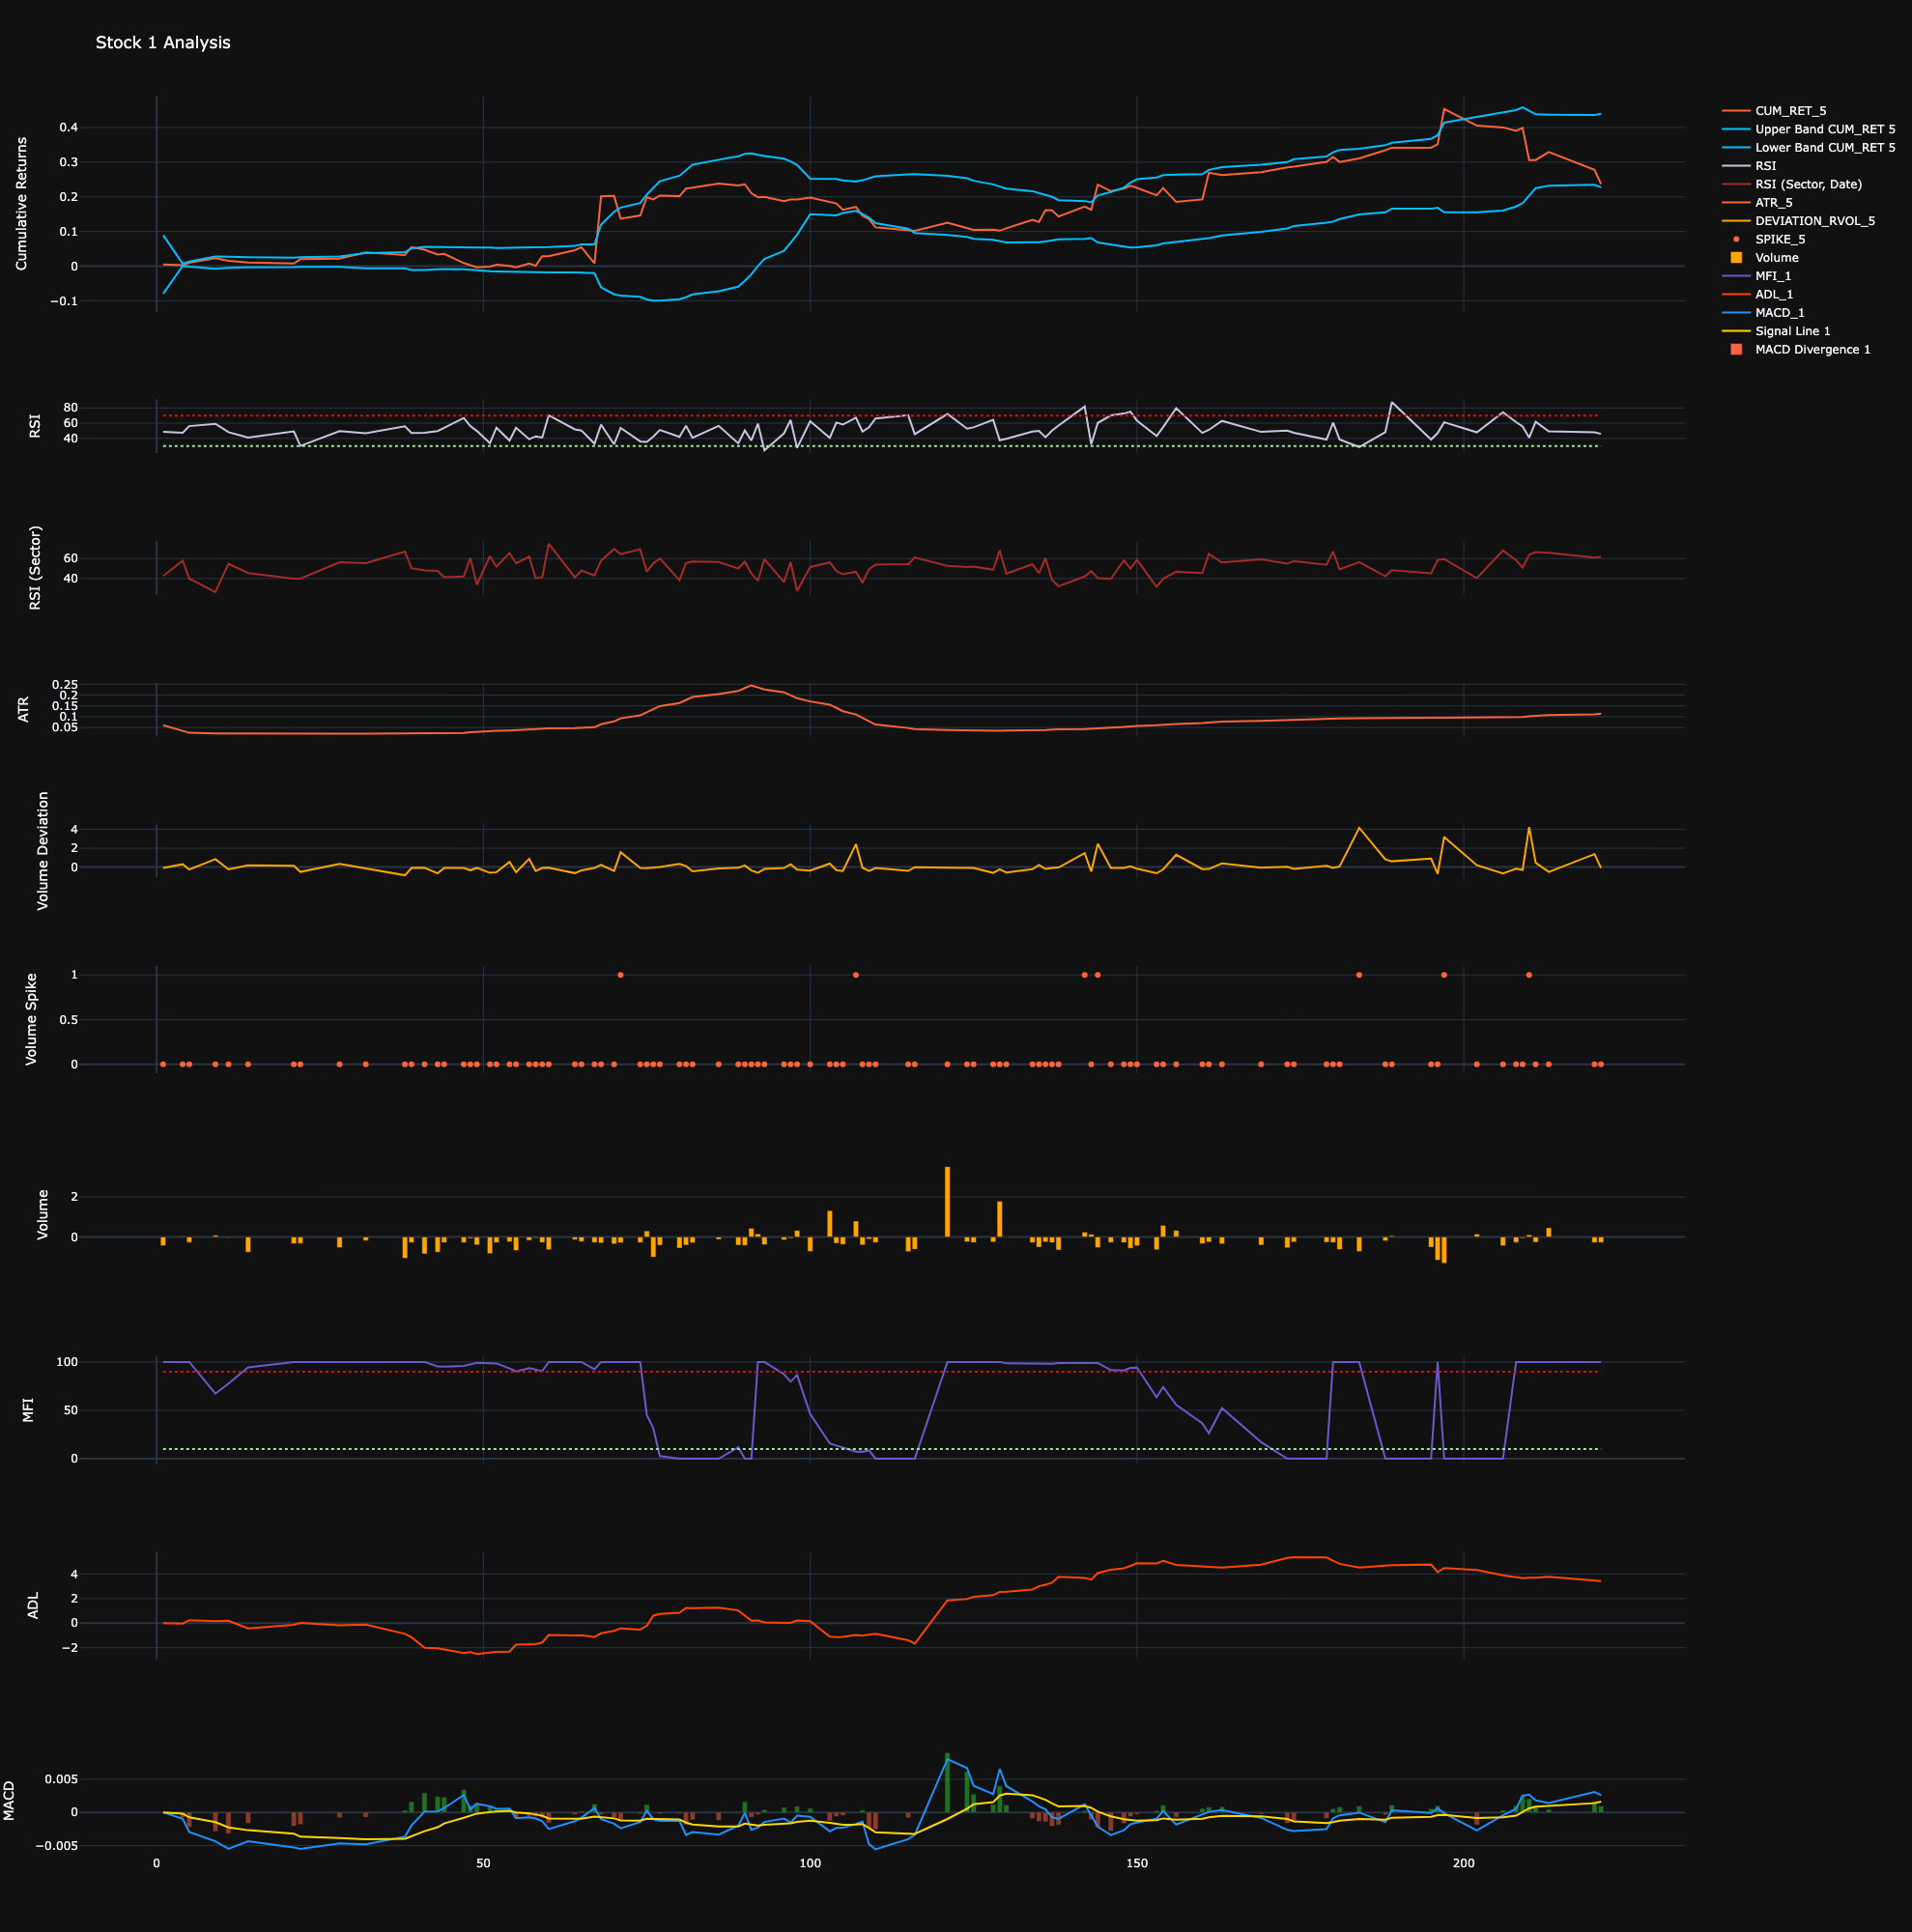
2. Technical Indicators
Money Flow Index (MFI):
Relative Strength Index (RSI):
Accumulation/Distribution Line (ADL):
Average True Range (ATR):
Moving Average Convergence Divergence (MACD):
Structure of this code
1. Cleaning Dataset
- Addressing missing values
- Deciding how to drop missing values depending on important features (RET_1 to RET_5)
- Deciding how to fill missing values (because of outliers, median is favored to mean)
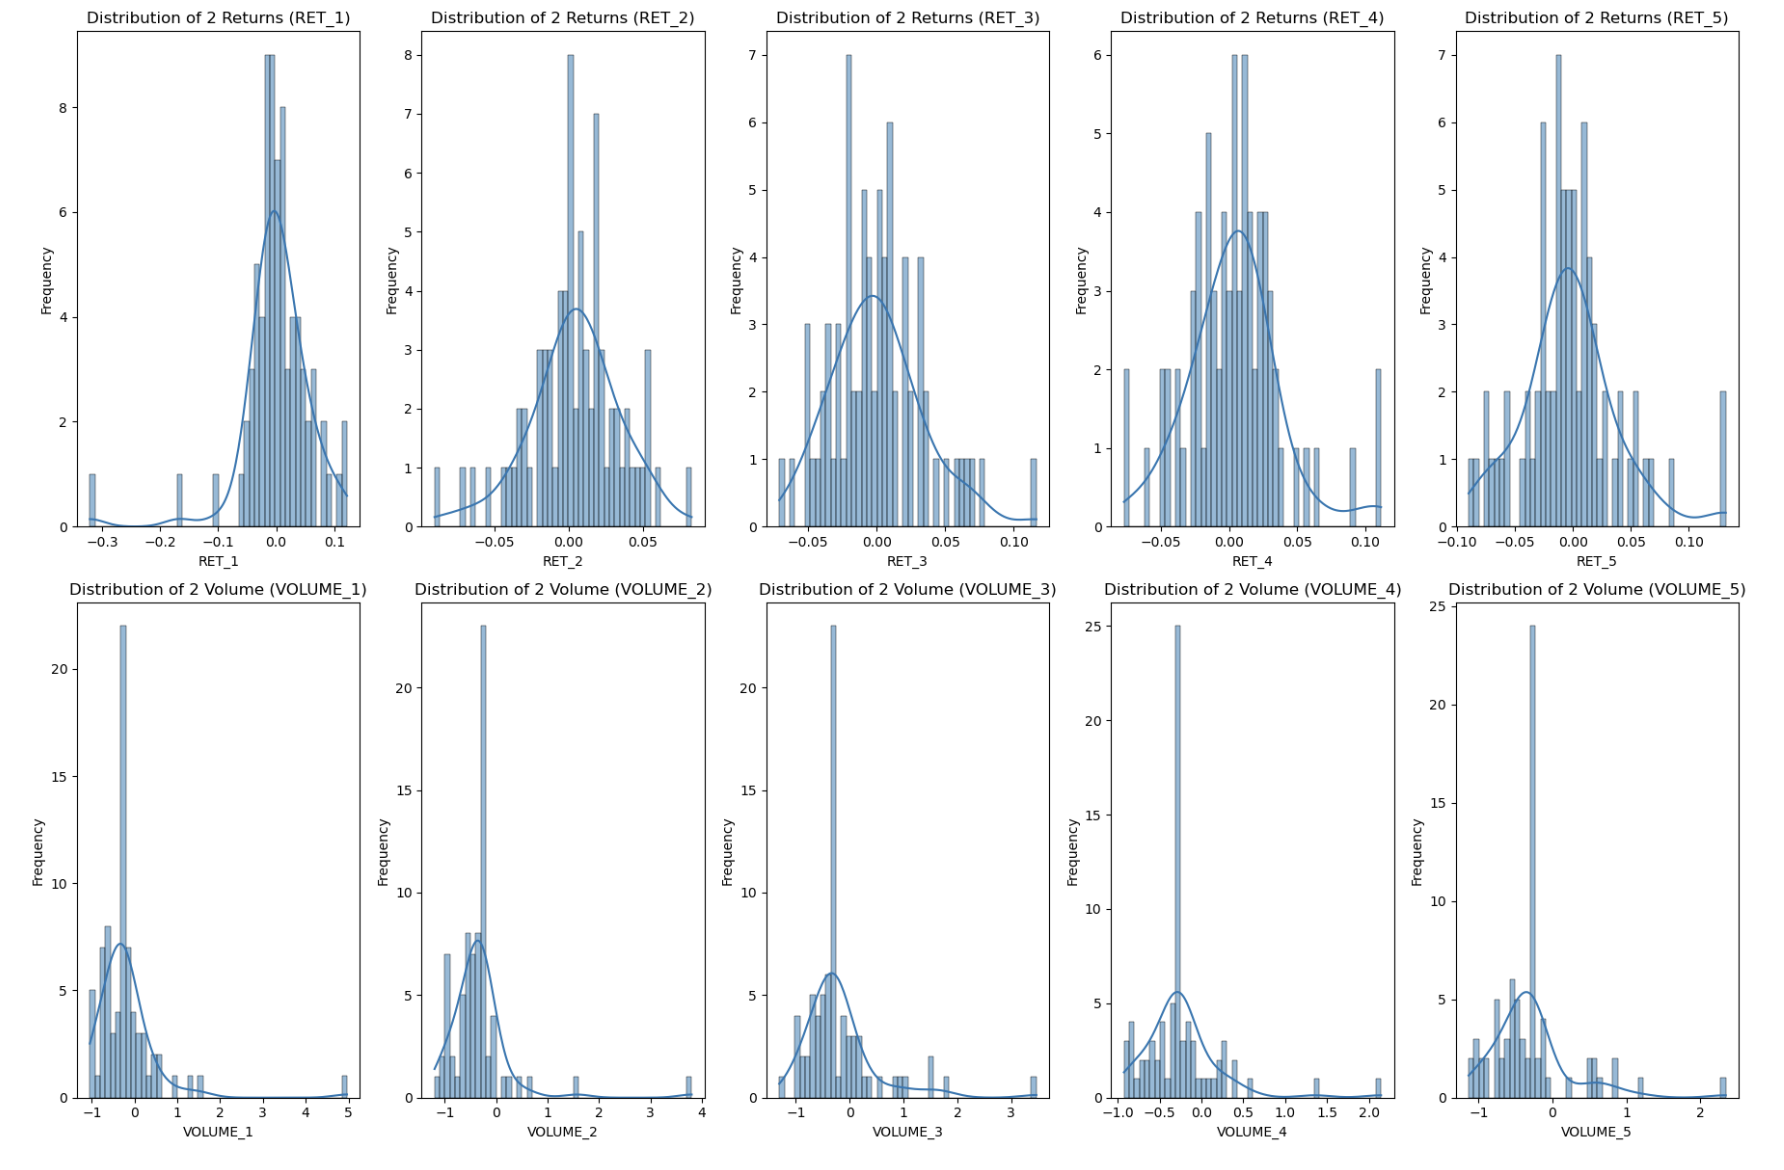
2. EDA
- Having a look at the distributions of the stocks' RET_i and VOLUME_i
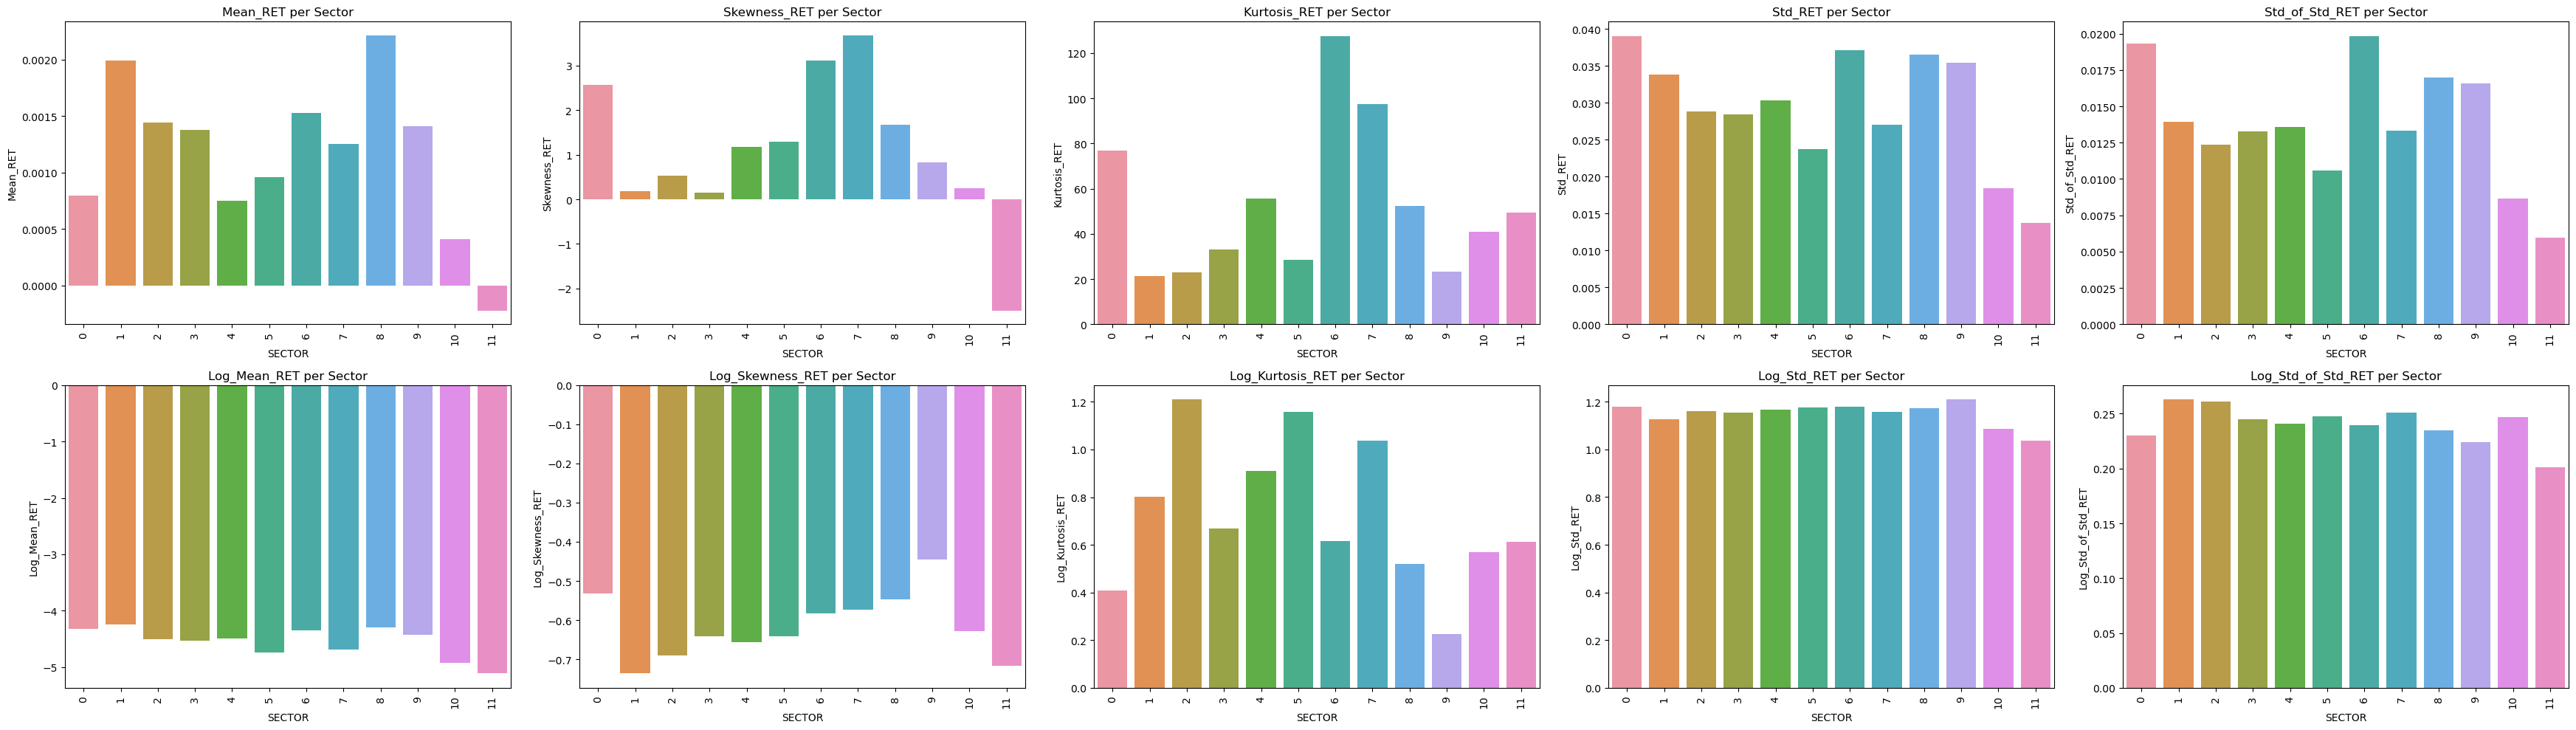
- Having a look at the distribution of the aggregated SECTOR and INDUSTRY’s RET_i and VOLUME_i
3. Feature Engineering
Technical Indicators: To extract information from our small dataset, technical indicators have been coded. I picked typical technical indicators and hard-coded them myself. Typically these can be found in the TA-Lib library though:
- Volatility Indicators: Volatility (Std), Volatility of Volatility (std of std) per stock and per sector and per stock adjusted per sector.
Statistical Indicators: To extract more information, I considered also factor investing. Factor investing has been already extensively covered in literature. The most pleasant read I have found recently about this is Chapter 7 of the new book of Giuseppe Paleologo here. Nonetheless, the way I went about it is straightforward. I have calculated Principal Components per SECTOR and INDUSTRY (aggregated per stock category), because this is where our time series lie, both whitened and not whitened. These didn’t seem to have a positive impact in terms of explainability of our target variable RET as much as the Technical Indicators, so you will find this at the end of the notebook.
4. Prediction Model
The model is a Random Forest applied with stratified cross-validation, to ensure proper assessment and avoid overfitting to any training part of the dataset.
5. Submission to the leaderboard
Outcome: As of today while writing this notebook: in the leaderboard, I am the 70th submission out of 399 submissions, I am in the top 17.3% percentile of submissions.
Future Work
Future ideas include:
- Think about how to leverage kurtosis and skewness of the distributions for statistically-driven feature engineering and indicators
- Read more extensively Giuseppe’s notes and get inspiration about more statistically and mathematically proven and robust methods to derive alpha
Repository and Resources
You can find the complete code and resources for this project in the GitHub repository linked below. The repository includes:
- Data preprocessing code
- Feature engineering methods
- PCA and beta calculation functions
- Model training and evaluation code